|
Previous Home Next
Implementation
5.1 Introduction
This chapter describes the entire
implementation process for the first stage of the proposed application. This
chapter gives a sequential list of the procedures and its details, which were
followed during the implementation process (Note: Some of the procedures may
have been performed iteratively as they may be dependent on each other). The
starting point of the implementation was research on available technologies
for 3D realtime rendering and databases followed by other procedures as
described in this chapter.
5.2
Research on available technologies
Four different types of
technologies were required in the implementation of this application:
- 3D realtime-rendering (e.g. OpenGL, DirectX, VRML,
Java3D etc.),
- Databases (e.g. MS Access, MySQL, XML etc.)
- Base programming languages (e.g. Java, C++ etc.)
and
- 3D content creation software (Visualisation software like
AutoCAD, 3DSMAX, CorelDraw etc.).
5.2.1 Technology selection criteria
There are currently many 3d
realtime-rendering technologies, database technologies, programming languages
and visualization software, each having their own drawbacks and advantages.
Selection of the appropriate technologies was very critical for successful
implementation. The following criteria was considered:
- Ease of use (XML, high level API)
- Availability and expense.
- Prior knowledge (Java, MS Access, MySQL, AutoCAD,
3DSMAX, Corel Draw, WordPad)
- Interconnectivity between all four technologies,
- Availability of support for the technologies,
- The time period (12 weeks) for the implementation
of the first stage of the application.
- Dependancies.
- Future potential of these technologies for future
expansion.
5.2.2 Selection of Java3D for realtime-rendering
- API is available free.
- Easy integration with Java although using Swing
components can be a problem due to heavy weight-light weight issues.
- Provides easy to use High-level 3D graphics API and
a realtime-rendering platform.
- Portable across various platforms (future
potential).
- Application can be easily made available on the
Internet with some modifications (future potential).
- Easy connectivity with visualization software
(using VRML, 3DS or DXF export in 3DSMAX, and corresponding VRML, 3DS,
DXF loader in Java3D).
- Although under development, strong support is
available through community discussion forums.
5.2.3 Selection of XML as Database:
- Easy and quick to use, learn, and implement,
- Portable across various platforms,
- Easy connectivity with java (Java API for XML
connectivity available free of cost),
- Can be used on the Internet,
- Requires no other software or server to run or view
its contents.
- No expense incurred as no software is required to
use this technology.
5.2.4 Other selections:
The time period was considered
very short to learn and use
- Other base languages and their further interconnectivity
to 3D graphics, databases and
- Visualization software for content creation.
Hence already known
technologies were used. Java (jdk 1.3) was chosen as base programming
language and AutoCAD, 3DSMAX, Corel Photo-Paint was chosen as visualization
software. Java provides easy connectivity with various databases by provision
of API’s. The facility to export 3DSMAX content into VRML or 3DS or DXF
format and the corresponding loaders provided by Java3D to read these formats
proved vital for selection of these industry standard commercial software.
Since licenses for these software packages were already available at the
University, no extra expense was required.
Considering these items, it was
concluded that the combination of Java, Java3D, XML and AutoCAD, 3DSMAX,
Corel PhotoPaint was an excellent selection for successful implementation of
the proposed first stage of the application (within the available time limit)
and possible future expansion.
5.3 Implementation task list (Top)
After selection of the right
combination of technologies, a list of expected main tasks was created to
keep a quick reference of all the tasks that needed to be performed in order
to achieve the final objective. The following list is a final list giving all
the main tasks that were performed:
- Integrate Java3D into SWING.
- Import VRML file.
- Import multiple VRML files.
- Explore structure of imported VRML File.
- Create Walk behavior (Keyboard Navigation).
- Create native file format using XML.
- Create associations between images, text, and
models.
- Test loading of native file format.
- Removal of visual-objects from Navigation Viewport,
on file open.
- Additions of new visual objects to Navigation
Viewport, on file open.
- Removal of visual-objects from Examination
Viewport, on file open.
- Create facility to clear Text, Image and
Examination Viewports.
- Create facility to show a bigger Image from the
images viewport (multiple windows).
- Create facility to show a new Text window from the text
viewport (multiple windows).
- Create picking of visual objects.
- Disposal and freeing up of resources on exit.
- Display Introduction text in Text Viewport on file
Open.
- Show text related to identified detailed visual
object
- Identify picked visual object
- Display Introduction image in Image Viewport when
file is opened
- Create loading of detailed visual object
- Identify detailed visual object
- Show image related to identified detailed visual
object
- Identify which viewport is active.
- Use of bounds to automatically show text &
image of the nearest visual objects.
- Separate toggles to stop & start automatic text
and image display.
- Image display when starting the tool (Splash
screen).
- Create Panning behavior (keyboard navigation).
- Create thumbnail viewer for all images.
- Create category text viewing
- Find and display distance information from the two
vertices.
- Visual objects building of prototype.
- Create associations between VRML, images and text
(XML File) of prototype.
- Create Detailed Visual Objects of prototype.
- Create a method to show which objects are double
clickable.
- Create a method for showing feedback for long
processes (“loading…. objects”).
- Create Examination behavior (mouse)(Orbit
behavior).
- Create facility to show user manual in html format
by opening default browser.
- Create facility to open the default e-mailer to
send feedback to creator.
- Create facility to see details about the
application.
As the tasks were completed,
they were checked off. The task list went under constant revisions during the
entire implementation process.
5.4 Arrangement of geometry by
Java3D (Top)
This section explains two
diagrams, which show the arrangement of geometry by Java3D after reading a
VRML file and adding the required behaviors and other changes (e.g.
capabilities). These diagrams are called scenegraphs and they are used to
access or manipulate the geometry and its associated behaviors in Java3D.
This is only a representation while Java3D internally stores the data in a
different manner in order to carry out the required optimization process for
real-time rendering.
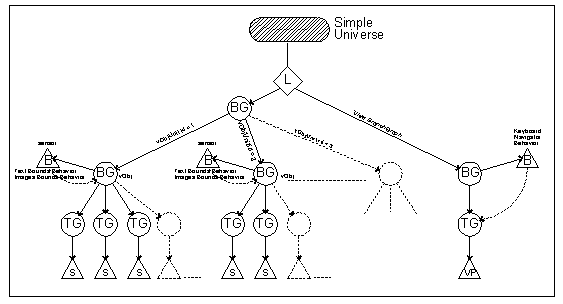
5.4.1 Navigation Viewport Scenegraph Arrangement
The navigation viewport is divided into two parts: a. Geometry
Branchgroup and b. View Branchgroup and addresses three different behaviors:
- Keyboard Navigation Behavior: This behavior is used
to navigate in the virtual world using the keyboard (see appendix 3 User
Manual No.4 for details) and hence requires the viewing platform to be
modified.
- Text Bounds Behavior and Image Bounds Behavior is
used to display the text or images or both (depending on the user
selection) when the view platform intersects the defined bounds in the
virtual world.
- Picking behavior (not shown in the diagram) which
allows identification of the vObjUnit and retrieve the associated text
and image information when the mouse is double clicked on a particular
part of the virtual world (if the information is available).
|
|
|
Figure
5.1: Scenegraph arrangement for Navigation viewport
|
The Geometry Branchgroup
consists of one main branchgroup. The branchgroup created by reading each
vObj is added to this branchgroup to form the entire virtual world for
navigation. Before adding any vObj branchgroups to the main branchgroup, the
bounds behaviors (text and image) are added to it and picking behavior is
added to transformgroup (TG) of each shape (S) contained in each vObj, along
with setting the appropriate capabilities. When a new file is opened, the
main branchgroup is removed thus removing all the geometry content, and a new
main branchgroup is added to the locale of the simple universe.
The Simple Universe class in the Java3D API provided
most of the View Branchgroup construction. The only modification is addition
of the keyboard navigation behavior to the transform group. The view
branchgraph is never removed.
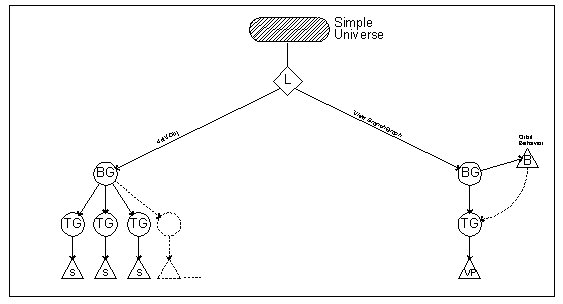
5.4.2
Examination Viewport Scenegraph Arrangement
Like the Navigation viewport,
this too is divided into two parts: a. Geometry Branchgroup and b. View
Branchgroup and addresses two different behaviors:
- Orbit Behavior: This behavior is used to rotate,
zoom or translate in the virtual world using various combinations of
mouse and keyboard buttons (see appendix 3 User Manual No.10 for details)
and hence requires the viewing platform to be modified.
- Picking behavior (not shown in the diagram) which
allows identification of the detVObjUnit and retrieve the associated
text and image information when the mouse is double clicked on a particular
part of the virtual world (if the information is available).
|
|
|
Figure
5.2: Scenegraph arrangement for Examination viewport
|
When a new file is opened or
the viewport is cleared, only the geometry branchgroup is removed from the
simple universe and a new one is added when appropriate.
Note:
- L – Locale; BG – BranchGroup; TG – TransformGroup;
S – Shape3D; B – Behavior; VP – View Platform
- Details on scenegrah diagrams – See
References-Bibliography No.10
5.5
Collection of data for content creation and database
building (Top)
For creating the content of the
St. George’s Database, the following types of data were collected:
- AutoCAD drawings (ground, first, second and site
plans only) from Estate Services, University of Sheffield. These
drawings were prepared by Peter Wright and Martyn Phelps architectural
Firm for refurbishment of the church to convert it into housing flats
and a lecture theatre for the University of Sheffield.
- A few partial sections (probably manually drafted –
no section through the tower) on A1 size paper from Estate Services and
prepared by the above named architects for the same purpose.
- A photocopied version of ordnance survey plan of
this area was available from the Local studies library (not included in
the database although it can be easily added).
- Historical text information from books available at
the Local studies library of Sheffield.
- Architectural text information from Listed building
information available from local studies library as well as the English
Heritage.
- Arial photograph from http://www.streetmap.co.uk (not
included in the database although it can be easily added).
- A few old photographs were available on some
Internet sites and books but were not used in the database to avoid
copyright issues. These can be easily incorporated in the database.
Hence as examples, many photographs were taken at the site and used in
the database to demonstrate the facility.
Note: All contact details are
provided in the “References” section.
5.6 Content Creation (Top)
This section describes the three main aspects that were
involved in the creation of the content that would be required in the
database of the proposed prototype. Three main formats (Geometry –VRML,
Images – JPEG and Text – TXT) were considered.
5.6.1 Geometry
The geometry of the prototype
(St. George’s Church) was created using the collected orthographic
projections (figure 5.3, 5.4 and 5.5) with reference to actual photographs
taken on the site. The first model was built in a standard style using
AutoCAD without consideration to polygon count limits. This was the first
step in the geometric content creation and was done in order to get a number
on how many polygons are required to accurately document the external view of
the prototype.
The first raw model resulted in
approximately 237,000 polygons (without the landscape and interior details)
when exported to 3DSMAX. AutoCAD does not entirely work on vertex-polygon
system, while number of polygons can be controlled via exporting AutoCAD file
to MAX. Textures were applied (using two sided materials wherever required).
The textured model was then exported into VRML format along with 4 lights and
tested. The frames/sec was benchmarked at 0.3 fps (see benchmarking below).
As this frame rate was completely unacceptable, the model was taken up for
thorough optimization, the aim being achievement of a respectable frame rate
of 10 – 13 fps on the target machine. The optimization included the following
processes:
- Control the number of polygons while exporting from
AutoCAD to MAX by changing the “Surface Deviation” parameter yet without
losing the accuracy. Through this parameter, the model was brought down
to 120000 polygons without any loss of detail.
- Removal of unwanted and unseen polygons.
- Changing all the textures to single sided and
flipping the normals of the polygons to their correct orientation
- Welding the duplicate vertices to reduce the number
of vertices and thus the data size.
- Splitting the model into smaller parts to make
maximum utilization of view culling.
- Splitting the model into instance-able parts to
reduce the data size and thus decrease the loading time.
Finally the model was good
enough to show individual detailed objects in the examination viewport
(approx. 10000 polygons per detailed part of the structure – each detVObj in
XMLFile). The model for navigation was stripped off of complicated details
(mostly curved surfaces) and curved surfaces were further optimised until the
number of polygons was reduced to approximately 28000. This gave a frame rate
of 9 to 13 fps on the target machine and was considered sufficient for a
smooth walk through.
|
|

|
|
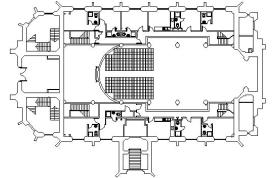
Figure
5.3: AutoCAD Plan of St. George’s
|
|
|
|
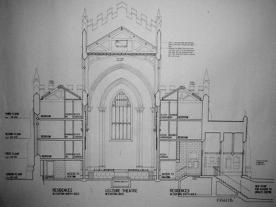
Figure
5.4: Paper Drawing of Cross Section
|
Figure
5.5: AutoCAD Model
|
For creation of individual detailed parts of the
structure (to be rendered in the examination viewport), the 12000-polygon
model (after the above mentioned six processes and before stripping) was
used. This model was further split into logical parts of the structure
according to the availability of text and image based information (although
some information was not available and is indicated accordingly). The
examination viewport thus, allows close scrutiny of every detail of the
structure and hence forms the most important aspect of this application.
The following modeling
processes were documented during the process of creating the geometric
content using AutoCAD, MAX and Corel PhotoPaint.
- The model is to be built in AutoCAD using
decimeters.
- AutoCAD file should be exported into MAX using Weld
Threshold of 0.01 (only if the model is precise, else the vertices not
required to be fused, may get welded resulting in a bad, inaccurate
model) and Surface Deviation set to 3 for detailed model (this gives
less polygons as well as good curved surfaces). Weld option can be kept
unselected while exporting, as the number of vertices does not affect
the frame rate in any way. For low polygon model, surface deviation of
12 should be used.
- The visual objects should be located near or around
the origin as the camera position will be at origin (model should be
moved in MAX only after the model has been finalized or ensure that the
AutoCAD model is in the correct position right from the beginning).
- The model is to be exported into VRML’97 file
format from MAX for final use in the XML file.
- All visual objects should be editable meshes (i.e.
no primitives or shape-extrudes should be used)
- All primitives should be collapsed to editable
meshes before applying UV mapping and then exported.
- Grouped objects should not be used.
- Lights should be kept in separate file.
- Separate file should be created for each
double-clickable visual object.
- Separate file should be created for sensors
details.
- Separate file should be created for high level of
detail models. These should be located at the origin to allow proper
rotation about its center. Ideally these could be in the same location
as the lower level of detailed models, so they can be used as LODs if
required.
- Textured material should have diffuse colour as
close to the texture colour. This is for proper texture and colour
modulation for Gouraud shading in Java3D.
- Double-sided textures should not be used.
- Bitmap size should not be higher than 128 x 128
pixels. Hi-resolution textures affect the fps to some extent (see
benchmarking).
- Repetitive visual objects should be instanced. This
drastically reduces the VRML file size and hence the loading time. But
this does not affect the real time rendering time in any way.
- All polygons, which are not seen or are duplicated
or are unwanted, should be removed (e.g. if interior is not to be
considered, all polygons which are inside the structure should be
removed). This also removes the z-buffer effect.
- Ensure that no two polygons are exactly in the same
position. This causes z-buffer effect (flickering).
- Sensor (i.e.Bounds) geometry should not overlap or
be inside one another.
- Use 2 omni lights, one at about intensity 3, and
the other at about 2.5. Place the two lights diagonally opposite each
other. Also place them in such a manner that for each light the
right-angled facades form an approximate 30-60 relation with the rays
from the light. Each facade will have a different shade for all four
facades and it will give a good edge definition (especially if textures
on each facade is same).
- Mirroring should not be used for creating visual
objects in MAX since these visual objects are not exported properly into
VRML. The UV coordinates are not calculated properly and results in
undesirable texture rendering. Wherever possible use “rotate” and incase
of visual objects, which are exact mirror, these should be created
independently in AutoCAD.
- Number of polygons on PIII 450, 16MB VRAM, 256MB
RAM system should not exceed:
- Approx. 30000 for navigation viewport
- Approx. 10000 for examination viewport.
5.6.2
Images
Site visits were made to
photograph the structure as and when required. The details were captured
using a digital camera (FujiFilm FinePix 1300) and edited using Corel PhotoPaint
to suit the following sizes:
- Big Images not greater than 576 x 432 pixels
- Small Images not greater than 201 x 151 pixels
AutoCAD orthographic projection
drawings were exported as JPEG images while the paper drawings were scanned
and edited.
Some areas of the Church (nave)
were not possible to be photographed due to inaccessibility and this would
require professional involvement.
5.6.3
Text
Text based information was
photocopied from books and OCR software was used to create a file of *.txt or
*.doc format. These files were then used to make further categories
(historical and architectural for each vObjUnit) as required for the various
parts in the database of St. George’s Church.
5.6.4
Benchmarking of the frame rate
Benchmarking was carried out
using J3Dfly VRML Browser developed and available from Java Sun Microsystems.
The following tables give the exact results of the benchmarking, which was
used to optimize the St. George’s Church Geometry content:
1. Actual St. Georges’ Church
File
|
Polygons
|
Lights
|
No. of Tex.
|
1s-Texture
|
2s-Texture
|
Fps
|
|
~237000
|
4
|
~15
|
Most
|
Few(~4)
|
0.3
|
|
~120000
|
4
|
~15
|
Most
|
Few (~4)
|
0.9
|
|
~038500 (optimized)
|
2
|
~15
|
Most
|
Few (~4)
|
1.7
|
|
~025000 (only tower)
|
2
|
~7
|
Most
|
Few (~2)
|
3
|
2. Tests with simple file 36000
polygons – high-res bitmaps (max about 1024 x 1024 pixels)
|
36000
|
2
|
11
|
All
|
None
|
3.9
|
|
36000
|
2
|
11
|
None
|
All
|
1.3
|
|
36000
|
2
|
10
|
All
|
None
|
3.9
|
|
36000
|
2
|
10
|
None
|
All
|
1.4
|
|
36000
|
2
|
07
|
All
|
None
|
4.8
|
3. Tests with same simple file
(as no.2) – very low-res bitmaps (max about 128 x 128 pixels)
|
36000
|
2
|
11
|
All
|
None
|
10
|
|
36000
|
2
|
11
|
None
|
All
|
1.85
|
|
36000
|
2
|
10
|
All
|
None
|
10.5
|
|
36000
|
2
|
10
|
None
|
All
|
1.85
|
|
36000
|
2
|
07
|
All
|
None
|
10.5
|
4. Tests with simple file 28800
polygons – very low-res bitmaps (max about 128 x 128 pixels)
|
28800
|
2
|
07
|
All
|
None
|
13.5
|
|
28800
|
2
|
07
|
None
|
All
|
2.2
|
|
28800
|
2
|
07
|
04
|
03
|
3.6
|
|
Table
5.1: Benchmarking results
|
5.7 Testing
(Top)
After content creation testing of the application was
carried out in much detail and it consisted of two parts - Specification
based (Black Box) testing and Usability Testing. For complete details refer
to the next chapter (No.6) on Testing.
5.8 Documentation
Documentation process was
considered important right from the Interim Report stage. Every effort was
made to document the progress, problems faced and solutions on each day. The
logbook is available for reference as an appendix 1 to this dissertation.
Previous Home Next
|

